2 Introduction to Data Science
Data Science is a rapidly evolving field that is transforming industries by leveraging computational, statistical, and analytical techniques. In the 21st century, data has become one of the most valuable resources, often called the “new oil” due to its potential to drive innovation and reshape the future.
Data science is the key to unlocking this potential. By applying computational, statistical, and analytical techniques, data scientists extract insights from vast amounts of data, enabling organizations to make informed decisions, optimize processes, predict trends, and develop intelligent systems. This has led to groundbreaking advancements in fields such as healthcare, finance, marketing, artificial intelligence (AI), and beyond.
Given its rapid growth and increasing demand, data science is more critical than ever. In this chapter, we’ll explore the fundamentals of data science, discuss its significance in modern society, and introduce the Data Science Workflow—a structured approach that data scientists use to transform raw data into actionable insights.
This section is well-structured and provides a clear introduction to data science. It effectively conveys the interdisciplinary nature of the field and highlights its core components. However, there are some areas where clarity, consistency, and flow can be improved. Below are my suggestions:
2.1 What is Data Science?
Data science is an interdisciplinary field that integrates computer science, statistics, and domain expertise to extract insights from data. It involves using analytical and computational techniques to process vast amounts of raw data, transforming them into meaningful information that supports decision-making and strategic planning.
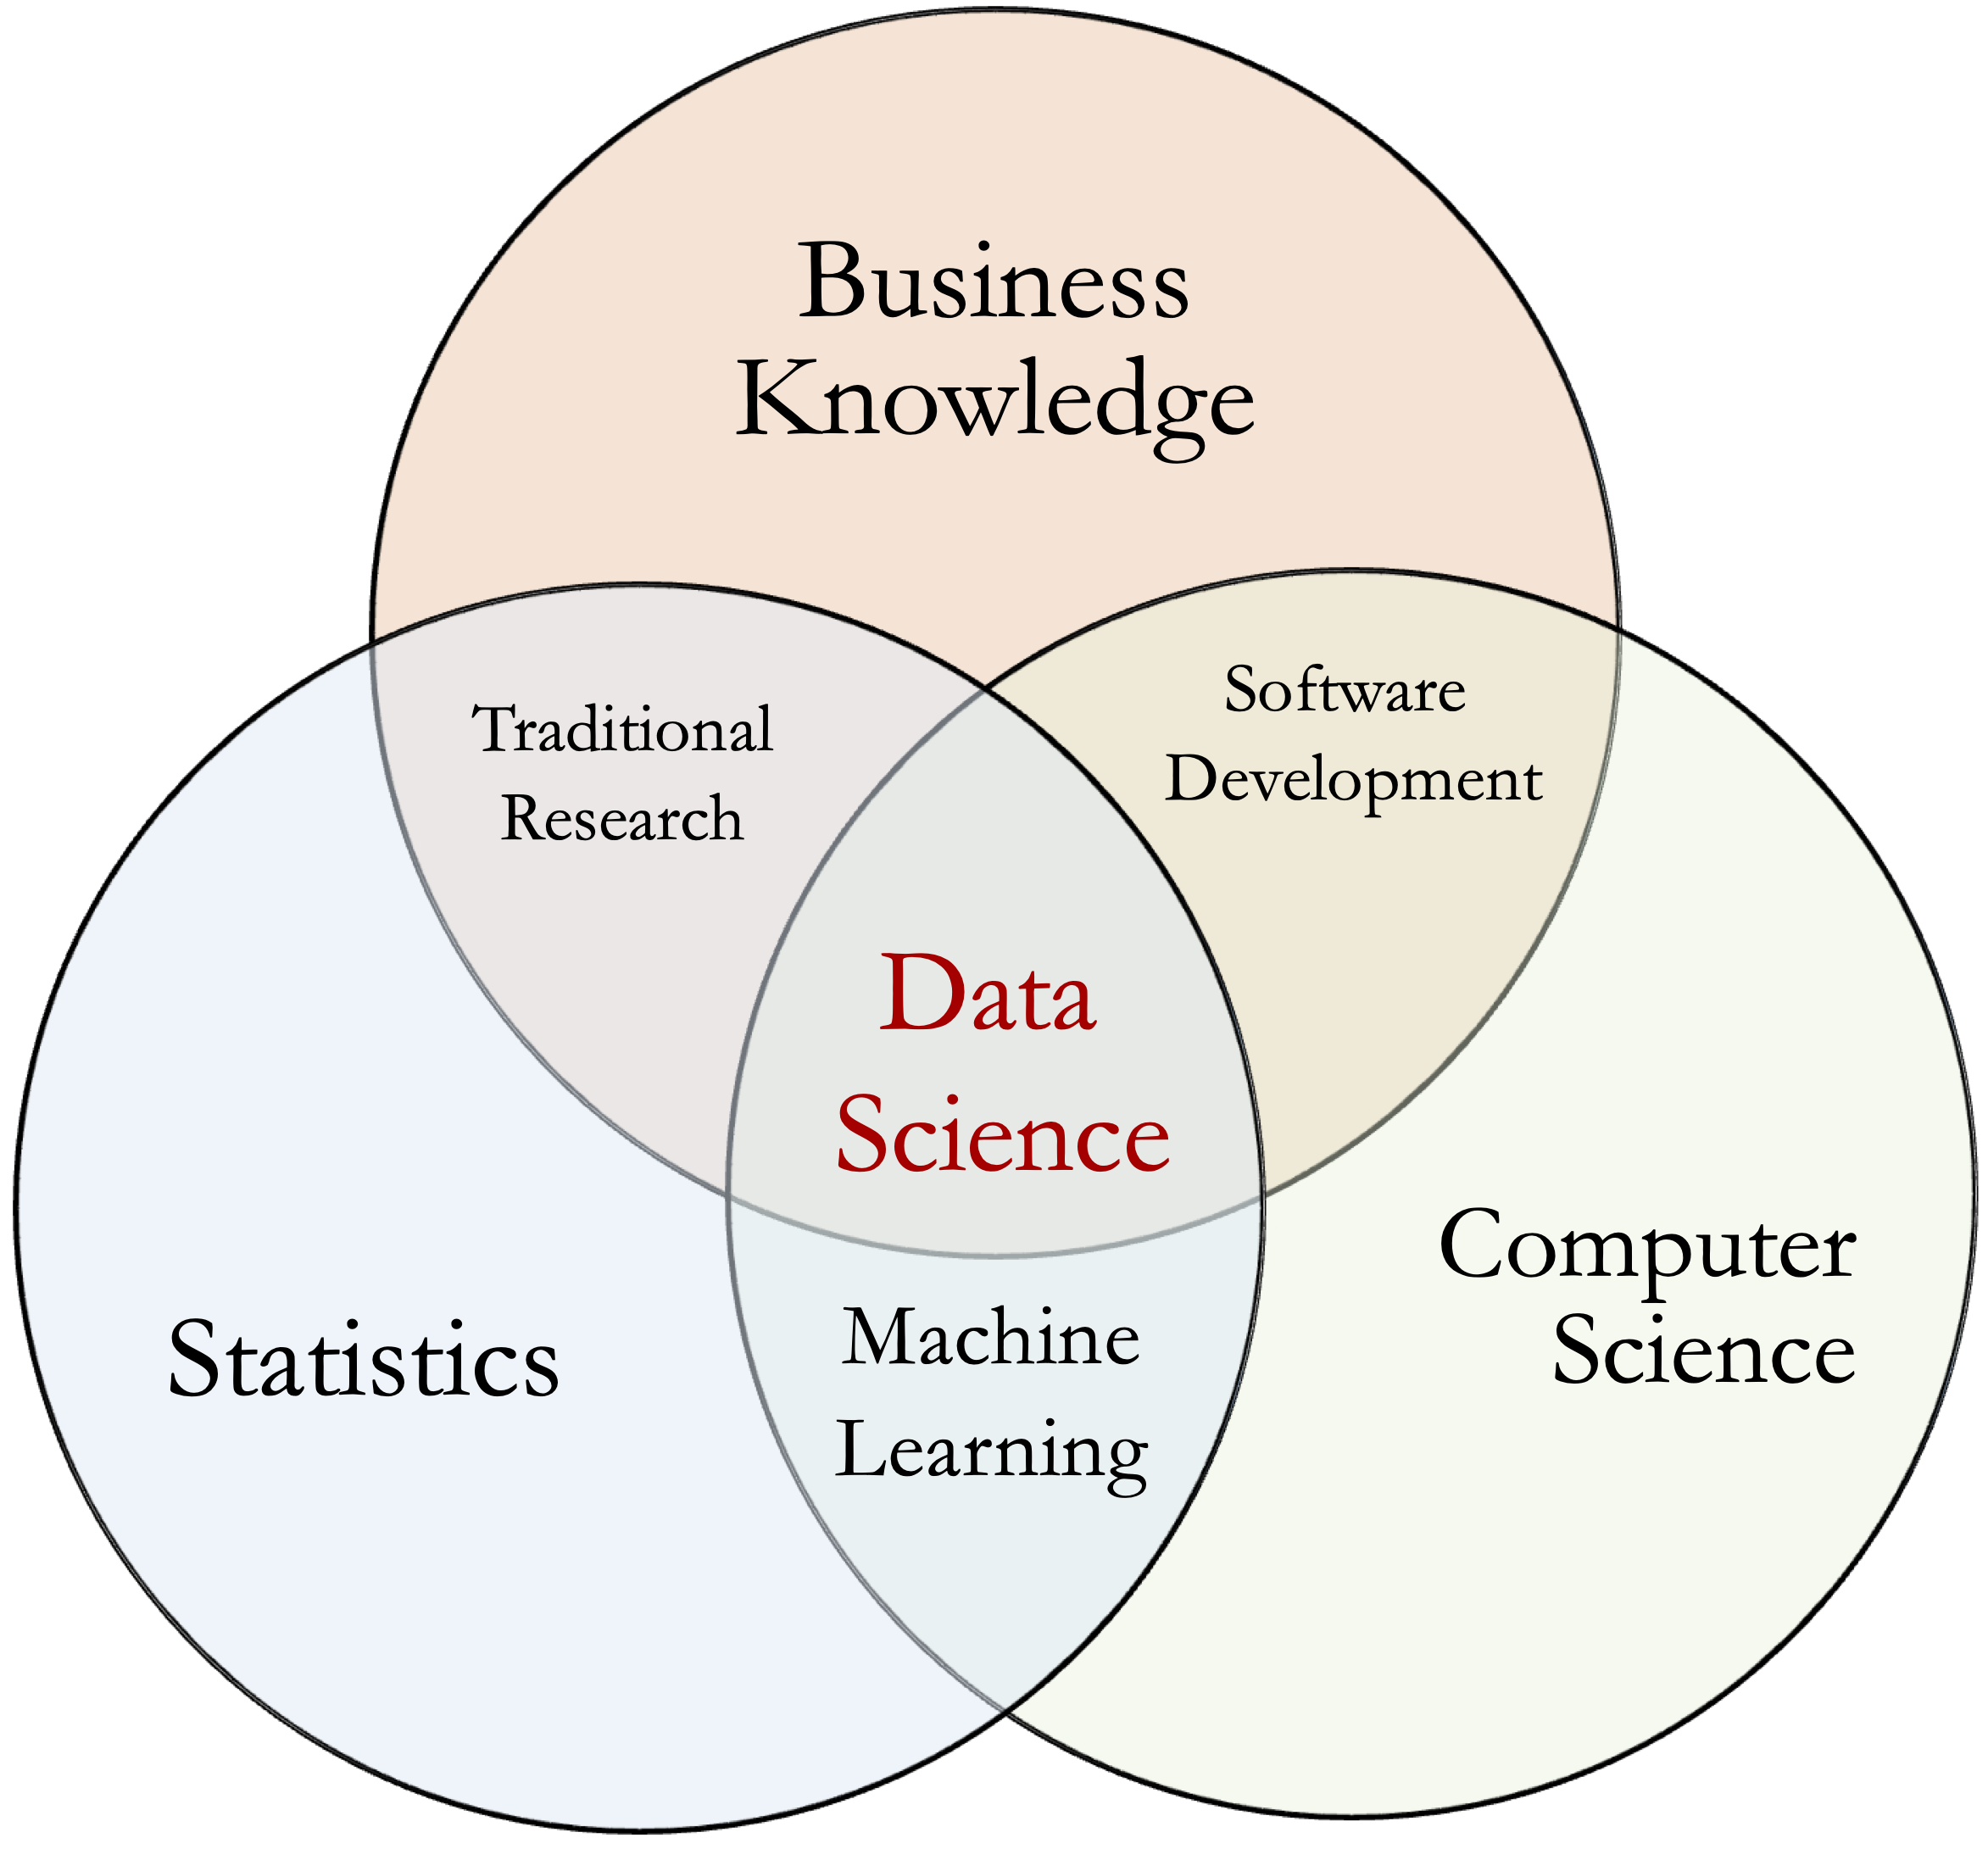
Figure 2.1: Data science is a multidisciplinary field that applies computational and statistical methods to extract insights from data.
Although the term “data science” is relatively new, its foundations lie in well-established disciplines such as statistics, data analysis, and machine learning. With the exponential growth of digital data, advancements in computational power, and the increasing demand for data-driven decision-making, data science has emerged as a distinct and essential field.
At its core, data science is concerned with extracting knowledge from data using a combination of statistical techniques, machine learning algorithms, and domain-specific methodologies. It helps organizations manage and understand the vast amounts of information generated in the digital age.
Key Components of Data Science
The field of data science encompasses three main components:
-
Data Engineering: The foundation of data science, responsible for collecting, storing, and structuring large datasets. This includes the development of data pipelines and infrastructure to enable efficient analysis. While crucial, data engineering is beyond the scope of this book.
-
Data Analysis and Statistics: The application of statistical methods to explore and analyze data. This includes data visualization, hypothesis testing, and predictive modeling. More details on this topic are covered in the Statistical Inference and Hypothesis Testing and Exploratory Data Analysis chapters.
- Machine Learning and Artificial Intelligence: The use of algorithms to identify patterns, make predictions, and extract deeper insights. This includes supervised and unsupervised learning, deep learning, and natural language processing. These concepts are discussed in the Modeling Process chapter.
2.2 Why Data Science Matters
In the digital age, data has become one of the most valuable resources and is often referred to as the “new oil” of the 21st century. This comparison makes sense, as some of the world’s most valuable companies today—including OpenAI, Google, and Apple—are driven by artificial intelligence and data science. Just as the wealthiest companies of the 20th century were those that controlled oil and energy, today’s leading enterprises leverage data as a key asset for innovation and competitive advantage.
Across industries, data-driven decision-making has become essential. Organizations generate vast amounts of data every day, and without the right tools and techniques, much of this data would remain untapped. Data science helps organizations uncover patterns, detect trends, and make informed decisions that enhance efficiency, reduce costs, and improve customer experiences.
Data science plays a crucial role in a wide range of sectors, including:
-
Finance: Financial institutions leverage data science for risk assessment, fraud detection, and algorithmic trading. Machine learning models identify anomalies in transaction patterns, improving fraud detection and regulatory compliance.
-
Marketing: Businesses use data science to analyze customer behavior, segment audiences, and create targeted marketing campaigns. Platforms such as Facebook and Google Ads leverage sophisticated algorithms to match advertisements with the most relevant audiences, improving engagement and conversion rates.
-
Retail and E-commerce: Companies like Amazon and Walmart use data science to optimize inventory management, predict demand, and personalize recommendations. By analyzing purchase history and browsing behavior, retailers can offer tailored promotions and enhance customer satisfaction.
- Healthcare: Hospitals and medical researchers use data science for disease diagnosis, patient risk prediction, and personalized treatment plans. By analyzing large datasets of medical records, institutions can identify high-risk patients and take preventative measures to improve health outcomes.
For example, Netflix applies data science to analyze viewing patterns and recommend personalized content to users, while supply chain optimization at Amazon ensures faster deliveries by leveraging predictive analytics.
2.3 The Data Science Workflow
The data science workflow follows an iterative and cyclical approach, where insights gained at each stage inform and refine subsequent steps. Unlike a strictly linear process, data science involves continuous refinement to enhance accuracy and efficiency. This structured approach ensures that data-driven projects are conducted systematically, balancing exploratory analysis, model building, and evaluation to derive meaningful conclusions.
A data science workflow follows a phased, adaptive approach within a scientific framework, transforming raw data into actionable knowledge. This transformation is often conceptualized using the DIKW Pyramid (Data → Information → Knowledge → Wisdom), as illustrated in Figure 2.2.
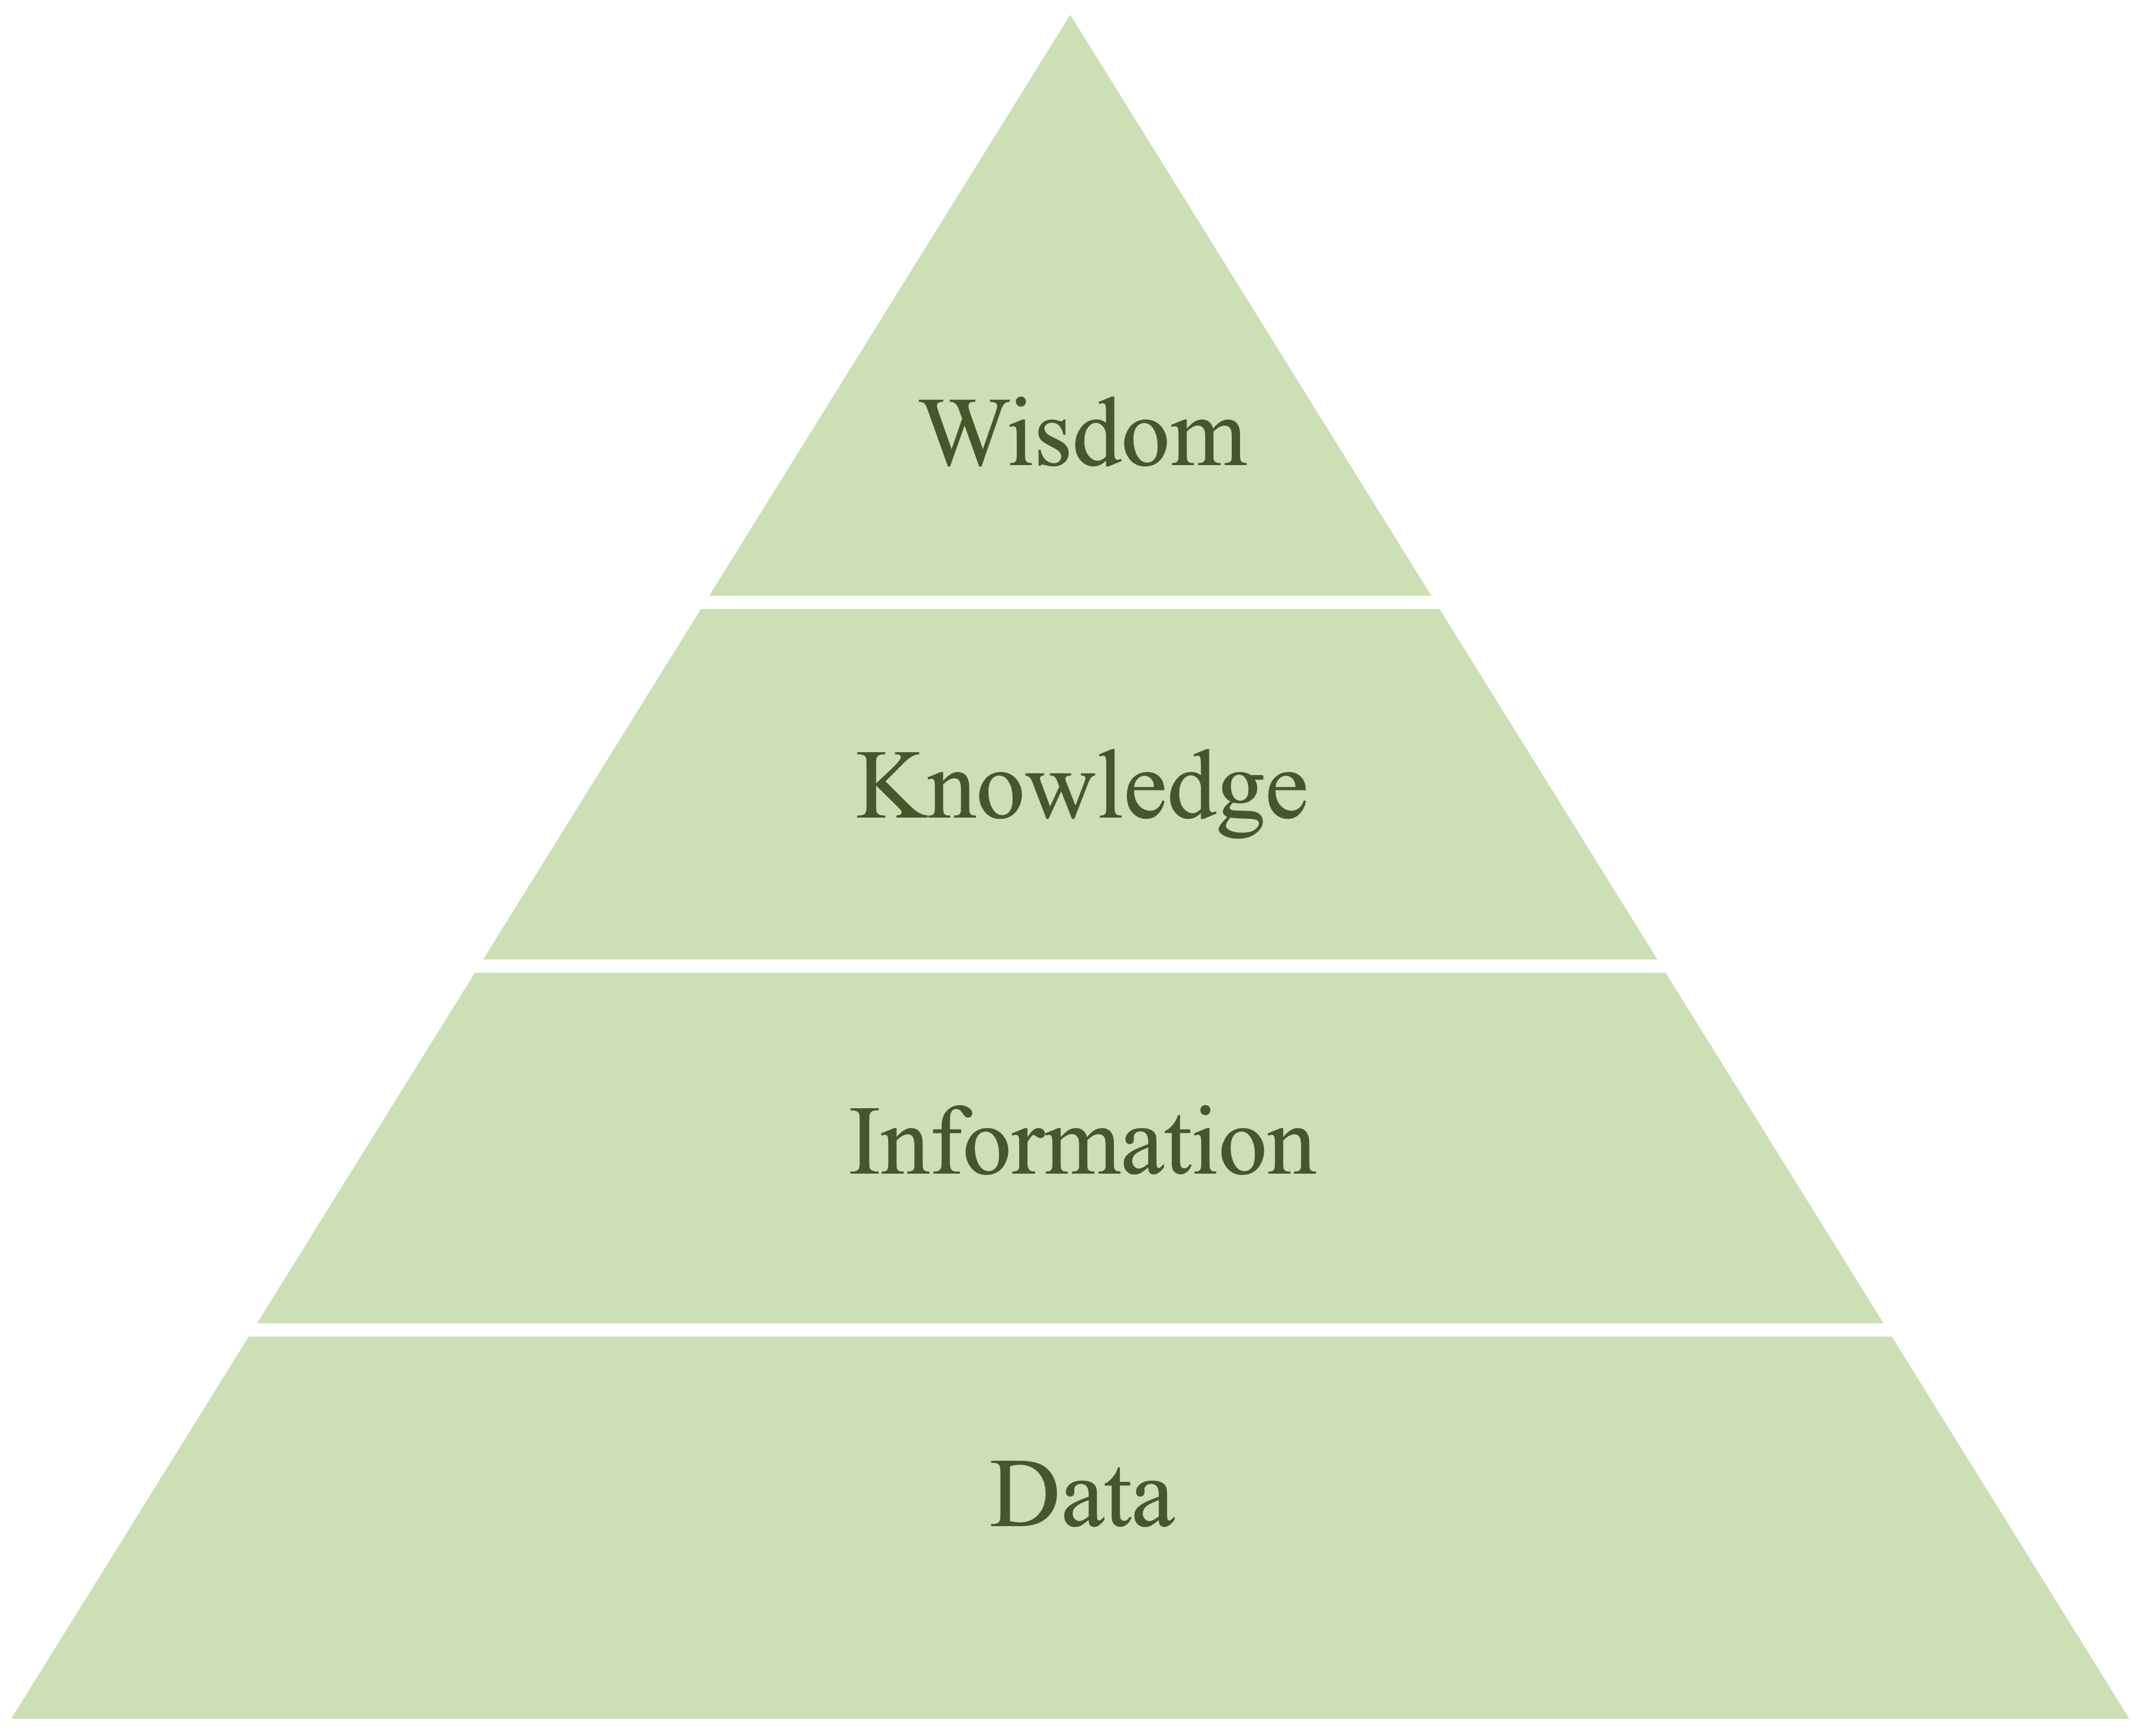
Figure 2.2: The DIKW Pyramid illustrates the transformation of raw data into actionable insights, progressing from data to information, knowledge, and ultimately wisdom.
While the specifics may vary across projects, most data science workflows follow a common structure. In this book, we adopt the Data Science Workflow as a guiding framework for structuring data science projects. This workflow is inspired by the Cross-Industry Standard Process for Data Mining (CRISP-DM) model, a widely recognized methodology for data-driven projects. It is a cyclic framework that guides data scientists through the following key stages (see Figure 2.3):
-
Problem Understanding – Defining the business or research question and outlining objectives.
-
Data Preparation – Collecting, cleaning, transforming, and organizing data to ensure it is suitable for analysis. This step includes handling missing values, addressing inconsistencies, detecting outliers, and preparing features through scaling, encoding, and transformation.
-
Exploratory Data Analysis (EDA) – Identifying patterns, distributions, and relationships within the data.
-
Preparing Data for Modeling – Engineering relevant features, normalizing data, and selecting meaningful variables.
-
Modeling – Applying machine learning or statistical techniques to develop predictive or descriptive models.
-
Evaluation – Assessing model performance using appropriate metrics and validation techniques.
- Deployment – Integrating the model into a production environment and monitoring its performance over time.
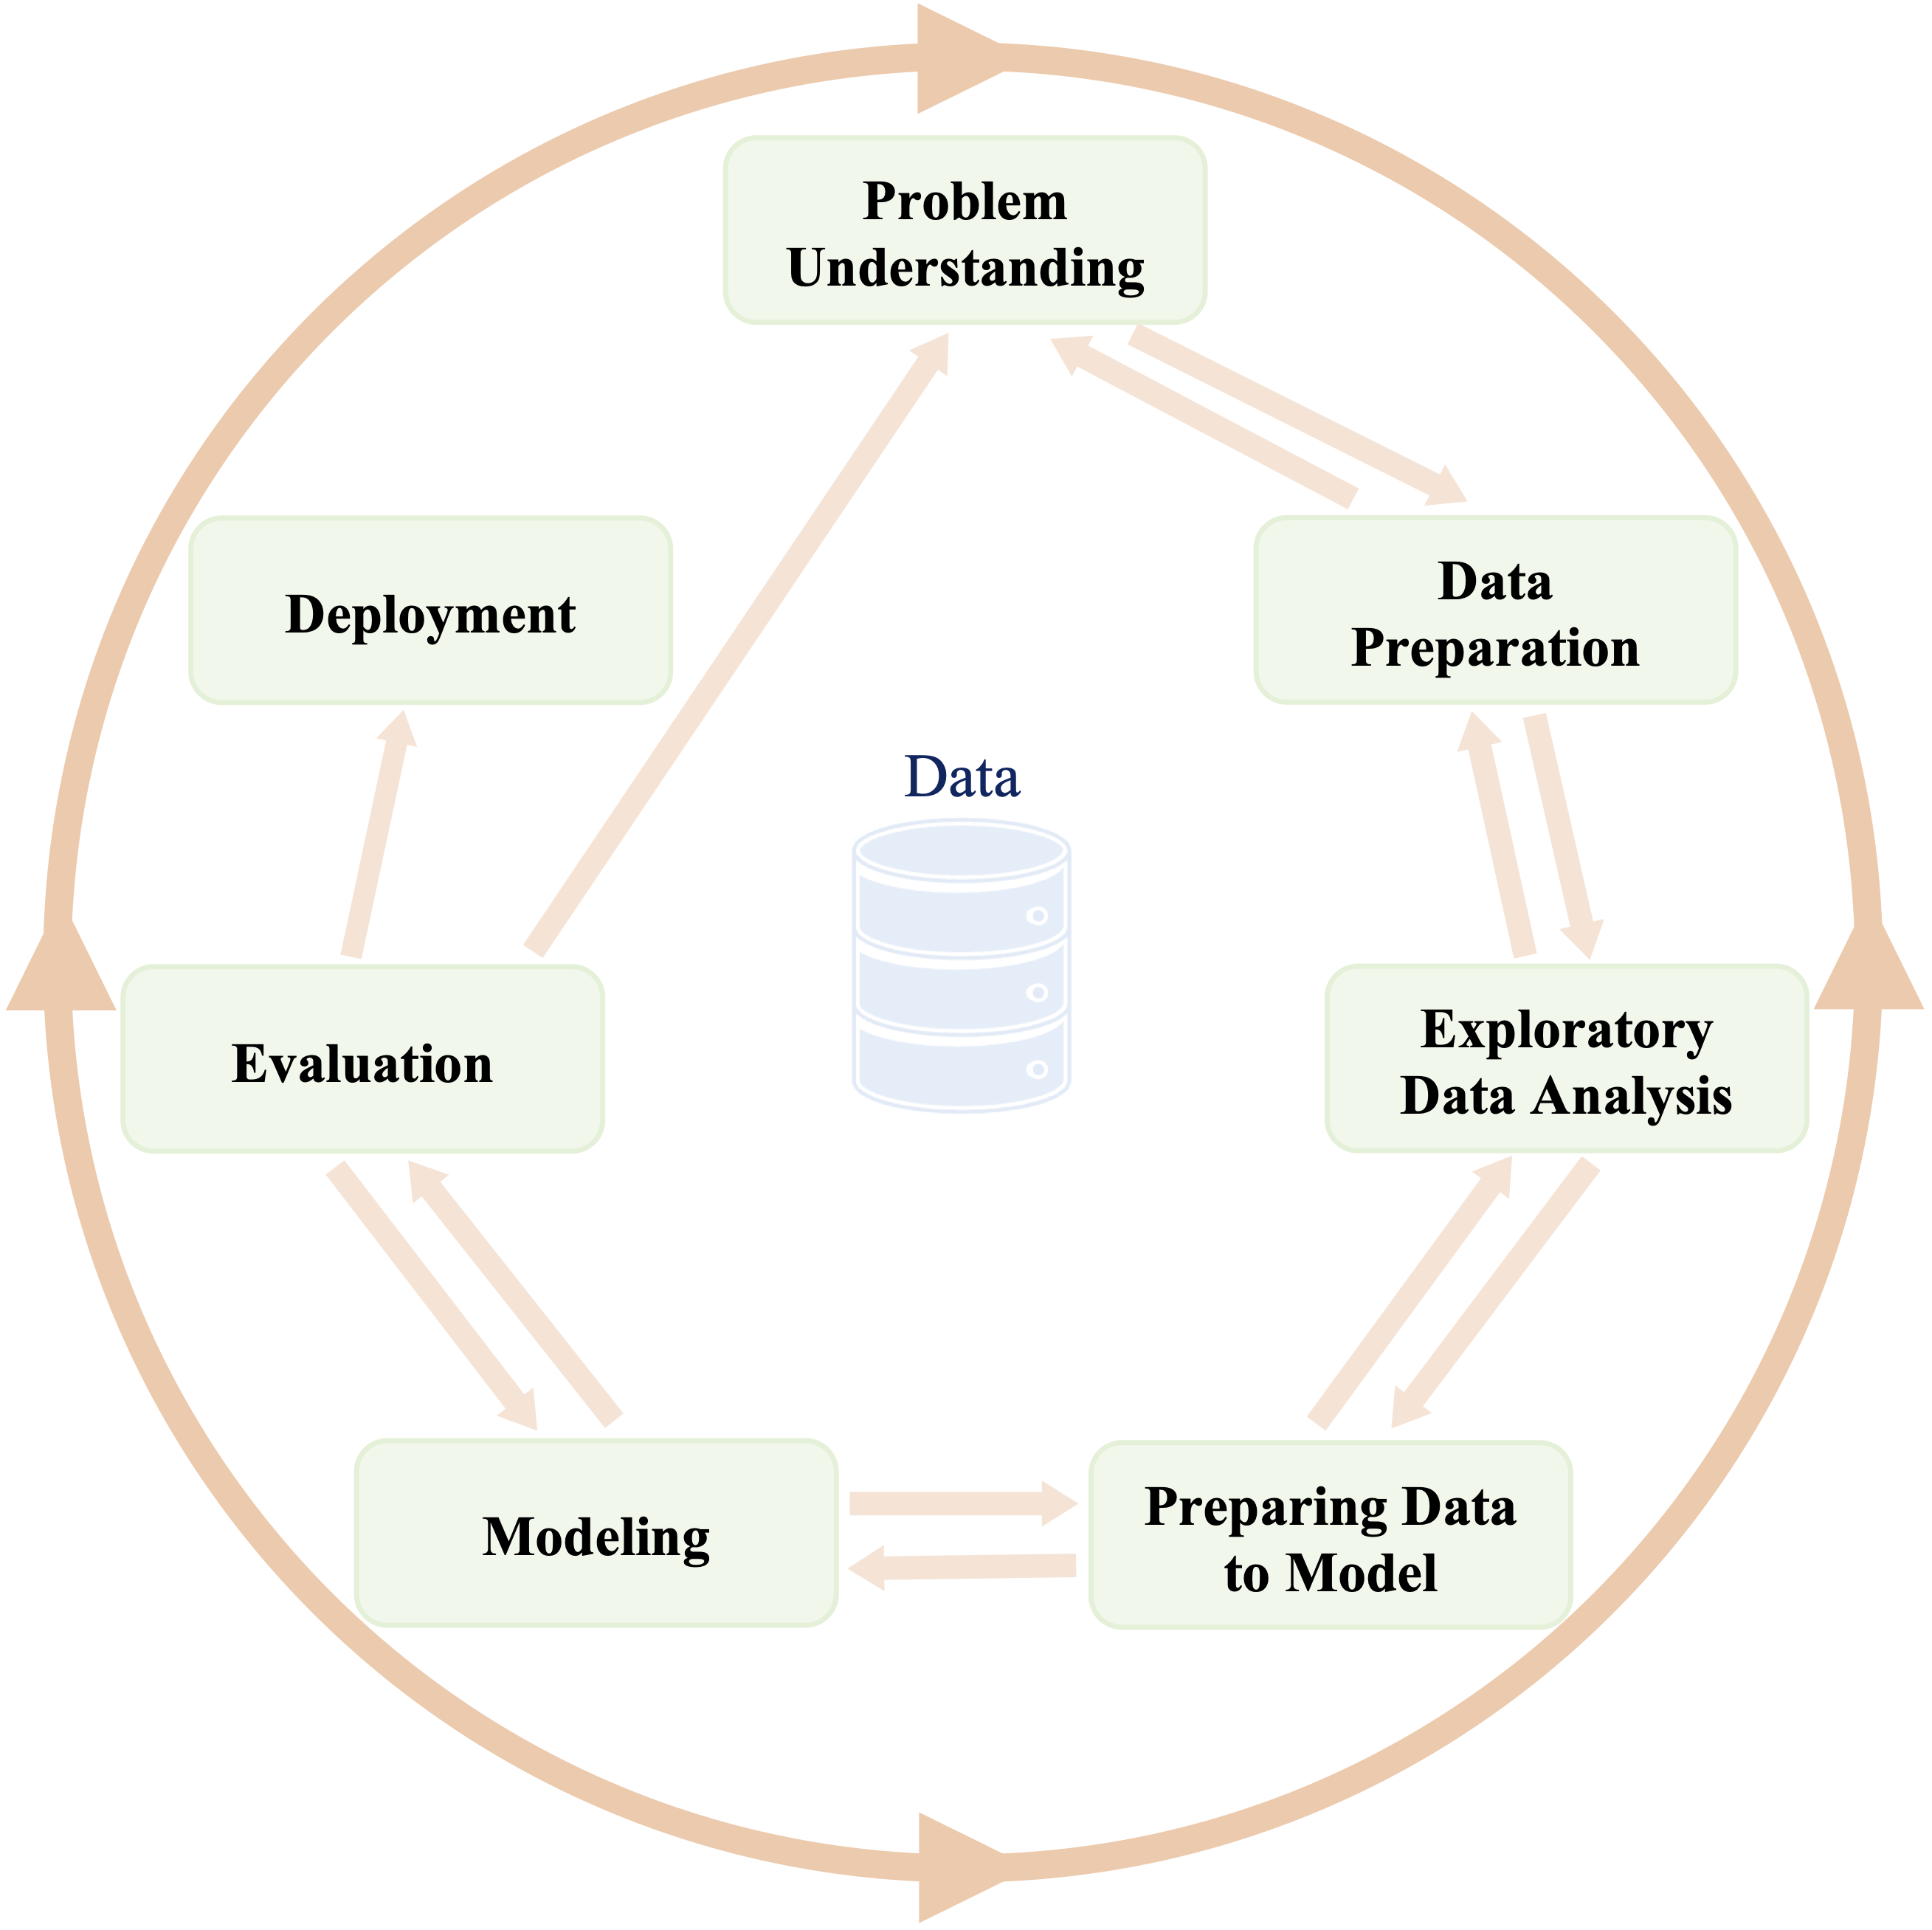
Figure 2.3: The Data Science Workflow is an iterative framework for structuring data science and machine learning projects. Inspired by the CRISP-DM model, it ensures systematic problem-solving and continuous refinement.
Because data science is inherently iterative, these steps are often revisited multiple times within a single project. The feedback loops between stages allow for continuous refinement—adjusting data preprocessing, modifying features, or retraining models as new insights emerge. By following a structured workflow, data scientists can ensure rigor, accuracy, and efficiency in transforming data into valuable insights.
2.4 Problem Understanding
The first step in any data science project is to clearly define the problem—whether it is a business challenge or a research question. This phase is crucial because data science is not just about building models; it is about solving real-world problems using data-driven approaches. A well-defined problem ensures that efforts are aligned with meaningful objectives, improving the likelihood of delivering actionable insights.
At this stage, data scientists work closely with stakeholders to understand the goals, clarify expectations, and define success criteria. The following questions help frame the problem:
-
Why is this research or business question important?
-
What is the desired outcome or impact?
- How can data science techniques contribute to addressing this question?
Focusing on the why and what before diving into the how is essential. As Simon Sinek emphasizes in his TED talk “How Great Leaders Inspire Action”, “People don’t buy what you do; they buy why you do it.” This concept applies to data science as well—understanding the deeper motivation behind a project provides clarity and direction.
For example, a data science team in a business analytics department may be approached by a client who wants a predictive model but lacks clarity on the specific problem they are trying to solve. Without a clear why, it becomes difficult to develop a solution that delivers real value. Similarly, students working on research projects often focus on what they want to build rather than why it is needed.
Suppose a company aims to reduce customer churn. A well-defined objective might be to develop a predictive model that identifies customers at risk of leaving so that targeted retention strategies can be implemented. This initial understanding helps frame the problem and guides the selection of relevant data, modeling techniques, and evaluation metrics.
Problem understanding is both an analytical and creative process. While data science provides tools and methodologies, defining the right problem requires domain expertise and critical thinking. The following steps help ensure a structured approach:
- Clearly articulate the project objectives and requirements in terms of the overall goals of the business or research entity.
- Break down the objectives to outline specific expectations and desired outcomes.
- Translate these objectives into a data science problem that can be addressed using analytical techniques.
- Draft a preliminary strategy for how to achieve these objectives, considering potential approaches and methodologies.
By thoroughly defining the problem, data scientists set the stage for an effective workflow, ensuring that subsequent analysis and modeling efforts remain aligned with meaningful outcomes.
2.5 Data Preparation
Once the problem is well-defined, the next step is data preparation, ensuring the data is accurate, complete, and well-structured. Raw data often contains missing values, inconsistencies, and outliers, making this phase critical for reliable analysis. Poorly prepared data can lead to misleading insights, even with sophisticated models.
Data can originate from various sources, including databases, spreadsheets, APIs, and web scraping. It may be structured (e.g., numerical data in databases) or unstructured (e.g., text, images). Preprocessing is essential before analysis.
Key steps in data preparation include:
-
Data Collection and Integration: Merging data from multiple sources while ensuring consistency.
-
Handling Missing Values: Removing, imputing, or flagging incomplete data.
-
Outlier Detection: Identifying and managing extreme values using visualization.
-
Resolving Inconsistencies: Standardizing formats, correcting errors, and aligning categorical values.
-
Feature Engineering: Transforming data through encoding, scaling, and normalization for model compatibility.
- Data Summarization: Checking variable types, computing summary statistics, and detecting duplicates.
Though time-consuming, data preparation is essential for accurate modeling and meaningful analysis. In Chapter 3, we explore these techniques further with real-world examples.
2.6 Exploratory Data Analysis (EDA)
Exploratory Data Analysis (EDA) is a fundamental step in the data science workflow, providing an initial understanding of the dataset before formal modeling. The primary objective of EDA is to uncover patterns, relationships, and anomalies in the data, helping data scientists refine hypotheses and validate assumptions. By systematically examining the data, EDA ensures that the subsequent modeling process is informed by a solid understanding of the dataset’s structure and characteristics.
Several key techniques are commonly used in EDA:
-
Summary statistics – Measures such as the mean, median, standard deviation, and interquartile range provide insights into the distribution and central tendencies of numerical variables.
-
Data visualization – Graphical techniques, including histograms, scatter plots, and box plots, reveal data distributions, trends, and potential outliers.
- Correlation analysis – Examining relationships between numerical features using correlation coefficients helps identify dependencies that may influence modeling decisions.
EDA serves both diagnostic and exploratory functions. It helps detect data quality issues, such as missing values or inconsistencies, while also guiding feature selection and engineering. For instance, if a strong correlation exists between certain features and the target variable, these features may be prioritized in the modeling phase.
A thorough EDA process not only improves the quality of the dataset but also enhances the interpretability and reliability of analytical results. In Chapter 4, we will explore EDA techniques in greater detail, applying them to real-world datasets to illustrate practical applications.
2.7 Preparing Data for Modeling
With insights from EDA, the next step is to prepare the data for modeling. This stage involves feature engineering, feature selection, and data splitting—all of which are crucial for building effective models.
-
Feature Engineering: Creating new features or transforming existing ones to enhance model performance. For example, deriving new variables by combining existing ones or applying transformations can provide additional predictive power.
-
Feature Selection: Identifying and selecting the most relevant features to improve model efficiency and prevent overfitting. Removing irrelevant or redundant features simplifies the model and enhances interpretability.
- Data Splitting: Dividing the dataset into training, validation, and testing sets. The training set is used to develop the model, the validation set helps fine-tune parameters, and the test set assesses final model performance.
By the end of this stage, the data should be in a structured and well-prepared format, ensuring that models can learn effectively. In Chapter 6, we will explore these techniques in more detail and apply them to real-world datasets.
2.8 Modeling
Modeling is the stage where data scientists apply machine learning or statistical techniques to the prepared data to create a predictive or descriptive model. The goal is to build a model that effectively captures relationships within the data and generalizes well to new, unseen data.
The modeling process typically involves:
-
Choosing a Model: Selecting an appropriate model based on the problem type (e.g., regression, classification, clustering) and the characteristics of the dataset.
-
Training the Model: Fitting the model to the training data to learn patterns and relationships.
- Tuning Hyperparameters: Adjusting model parameters to optimize performance on the validation set.
Common algorithms include linear regression (Chapter 10), decision trees (Chapter 11), Naïve Bayes classifier (Chapter 9), k-Nearest Neighbors (k-NN) algorithm (Chapter 7), and neural networks (Chapter 12). Each method has its strengths and limitations, and selecting the most suitable model depends on the nature of the problem, data quality, and computational constraints. Often, multiple models are tested and compared to determine the best-performing approach.
2.9 Evaluation
Once a model is built, it must be rigorously evaluated to ensure its accuracy, generalizability, and robustness before deployment. The evaluation process relies on well-defined performance metrics, which vary depending on the type of problem. For classification models, commonly used metrics include accuracy, precision, recall, F1-score, and the area under the receiver operating characteristic curve (ROC-AUC). In regression tasks, measures such as mean squared error (MSE), mean absolute error (MAE), and the coefficient of determination (\(R^2\)) assess model effectiveness.
To ensure the model is not overfitting to the training data, cross-validation techniques, such as k-fold cross-validation, are employed. These methods provide a more reliable estimate of a model’s performance by partitioning the data into multiple subsets for training and validation. Beyond numerical evaluation, error analysis plays a crucial role in diagnosing weaknesses, particularly through confusion matrix interpretation for classification problems and residual analysis for regression. A careful examination of errors often reveals underlying biases, data inconsistencies, or model limitations that require refinement.
If the model fails to meet expectations, adjustments may be necessary, such as feature selection, hyperparameter tuning, or exploring alternative modeling approaches. In Chapter 8, we will explore these techniques in detail and apply them to real-world datasets.
2.10 Deployment
Once the model has been evaluated and meets the project goals, the final step is deployment, where it is integrated into a production environment to generate real-time insights or predictions. This phase is crucial for ensuring that the model contributes tangible value, whether by supporting decision-making processes or by automating tasks within operational systems. Models can be deployed in various ways, such as embedding them in web applications, integrating them into enterprise software, or automating processes in large-scale data pipelines.
Beyond initial integration, continuous monitoring is essential to track the model’s performance and detect potential issues. As real-world data evolves, models may experience concept drift, where their predictive accuracy deteriorates due to changes in underlying patterns. To mitigate this, periodic model updates and retraining are necessary to maintain reliability. Additionally, implementing robust logging and performance tracking mechanisms helps ensure that discrepancies between predicted and actual outcomes are quickly identified and addressed.
Deployment is not a one-time event but an ongoing process. Effective deployment strategies account for scalability, interpretability, and maintainability, allowing models to remain useful in dynamic environments. As the field of data science advances, the ability to manage deployed models effectively will continue to be a critical factor in transforming analytical insights into real-world impact.
2.11 Machine Learning
Data science relies on machine learning techniques to extract insights from data, make predictions, and uncover patterns. These methods enable data scientists to move beyond descriptive analysis and explore predictive and prescriptive approaches, which are essential for real-world applications. In this section, we provide an overview of machine learning, including its main types—supervised learning and unsupervised learning—and discuss how machine learning differs from statistical learning.
Machine learning is a branch of artificial intelligence that focuses on developing algorithms that learn from data and make predictions. Rather than being explicitly programmed for each task, machine learning models identify patterns within data and use them to make informed decisions. This approach is particularly useful for complex problems where rule-based programming would be impractical.
For instance, rather than defining a fixed set of rules to detect spam emails, a machine learning model can be trained on a labeled dataset of emails classified as “spam” or “not spam.” The model learns distinguishing patterns and can classify new emails with high accuracy. This ability to generalize from data makes machine learning invaluable in fields such as finance, healthcare, and marketing.
Machine Learning Tasks: Supervised vs. Unsupervised Learning
Machine learning tasks can be broadly categorized into supervised learning and unsupervised learning, which differ in terms of how models learn from data and the objectives of the analysis.
Supervised learning involves training a model on a labeled dataset, where each data point is associated with a known output. The goal is for the model to learn the relationship between input features and the corresponding output, enabling it to make accurate predictions on new data. Common supervised learning tasks include classification and numeric prediction. In classification, the model assigns data points to predefined categories, such as detecting whether an email is spam or identifying whether a patient has a particular disease. This book covers classification techniques such as decision trees (Chapter 11), the Naïve Bayes classifier (Chapter 9), and the k-Nearest Neighbors (k-NN) algorithm (Chapter 7). Numeric prediction, also known as regression, focuses on estimating continuous values, such as forecasting house prices based on location and size. A detailed discussion of regression techniques is provided in Chapter 10.
Unsupervised learning, on the other hand, is applied to datasets that lack labeled outputs. The objective is to uncover hidden patterns, relationships, or structures within the data. Clustering, a common unsupervised learning technique, groups data points based on similarity, such as segmenting customers according to purchasing behavior. Another important unsupervised learning method is pattern discovery, also known as association rule learning, which identifies relationships between variables. This technique is widely used in market basket analysis to detect frequently co-purchased items. These concepts are explored in further detail in Chapter 13.
In summary, supervised learning is used when labeled data is available and a specific predictive outcome is required, while unsupervised learning is beneficial for exploratory data analysis, where the goal is to identify underlying structures in unlabeled data. The distinction between these two approaches is fundamental to selecting appropriate machine learning techniques for a given data science problem.
2.12 Exercises
The following exercises will help reinforce the key concepts covered in this chapter. The questions range from fundamental definitions to applied problem-solving related to data science, the data science workflow, and machine learning.
- How does data-driven decision-making impact businesses? Give an example of a real-world application.
-
Data Science Workflow is inspired by the CRISP-DM model. What does CRISP-DM stand for, and how does it guide data-driven projects? What are the key stages of the CRISP-DM model?
-
Data Science Workflow and CRISP-DM model are not the only standard processes for data science projects. What are some other methodologies used in the industry?
- Do you think we can skip the Problem Understanding phase and directly jump to Data Preparation in a data science project? Justify your answer.
- Why is Data Preparation considered one of the most time-consuming steps in a data science project? What are some common challenges faced during this phase?
- To what extent can Data Science projects be automated without human intervention? What are the risks and limitations of relying solely on automated tools?
- For each of the following scenarios, identify the appropriate stage in the data science workflow:
- A company wants to predict customer churn based on historical data.
- A researcher is exploring the relationship between air pollution and respiratory diseases.
- An e-commerce platform is analyzing user behavior to personalize product recommendations.
- A hospital is developing a predictive model for patient readmission rates.
- A company wants to predict customer churn based on historical data.
- For each task, classify it as supervised or unsupervised learning, explain your reasoning, and identify a suitable machine learning algorithm that could be applied.
- Identifying fraudulent transactions in a credit card dataset.
- Segmenting customers based on purchasing behavior.
- Predicting stock prices based on historical data.
- Grouping news articles into topics using natural language processing.
- Identifying fraudulent transactions in a credit card dataset.
- Define a training dataset and a test dataset. Why are they important? How does improper splitting of these datasets affect model performance? Provide an example of a real-world issue caused by poor dataset partitioning.
- Many AI-driven systems have been criticized for biased predictions, such as hiring algorithms that favor certain demographics or facial recognition models that misidentify certain racial groups.
- What are some common sources of bias in data science projects?
- How can data scientists ensure fairness and mitigate biases in models?
- Give an example of a real-world case where bias in AI led to negative consequences.
- What are some common sources of bias in data science projects?
- Accuracy is a common metric used to evaluate models, but it is not always the best indicator of success. Consider a binary classification problem where only 2% of the cases are positive (e.g., detecting rare diseases or fraud).
- Why might accuracy be misleading in this case?
- What alternative evaluation metrics should be used?
- How would you decide whether a model is truly valuable for decision-making?
- Why might accuracy be misleading in this case?